Debunking the 'Buffett Indicator': Why a Record-High Market-Cap-to-GDP Ratio Doesn't Spell Doom for Investors
Money

Debunking the 'Buffett Indicator': Why a Record-High Market-Cap-to-GDP Ratio Doesn't Spell Doom for Investors

authorBy Dave Ramsey
DateJul 05, 2026
Read Time4 min
The "Buffett Indicator," which compares the total market capitalization of the U.S. stock market to the nation's Gross Domestic Product (GDP), has hit an all-time high. This has led many to believe the stock market is significantly overvalued and a major correction is imminent. However, a deeper look reveals that this traditional metric might not fully capture the current economic landscape. Changes in corporate profitability and the increasing global nature of U.S. company earnings suggest that the market, while high, may not be as excessively priced as the indicator alone implies. This analysis aims to provide investors with a more nuanced understanding of the market's current valuation, easing anxieties about a potential crash.

Challenging Conventional Wisdom: Is the Market Truly Overvalued?

Understanding the "Buffett Indicator" at its Peak: A Closer Look at Market Valuation

The market capitalization of the U.S. stock market now stands at an astonishing 136% of the nation's Gross Domestic Product (GDP), a figure approximately 70% higher than historical norms. This record-high valuation, often attributed to Warren Buffett's preferred metric, has naturally fueled a bearish outlook among many investors, suggesting the market is extraordinarily expensive. However, a critical examination of this indicator reveals potential limitations in its current application.

Re-evaluating the Indicator's Relevance: Why Past Rules May Not Apply Today

While Warren Buffett is renowned for his investment acumen and deep understanding of the interplay between the economy and stock market, his namesake valuation method might require reinterpretation in today's economic climate. This particular metric, comparing total market capitalization to GDP, has a significant blind spot: it excludes privately held companies and fails to account for the substantial growth in corporate profitability. Modern corporations, particularly those listed publicly, demonstrate a much higher collective profitability, both in absolute terms and relative to past decades.

The Disconnect: Corporate Profits Outpacing National Output

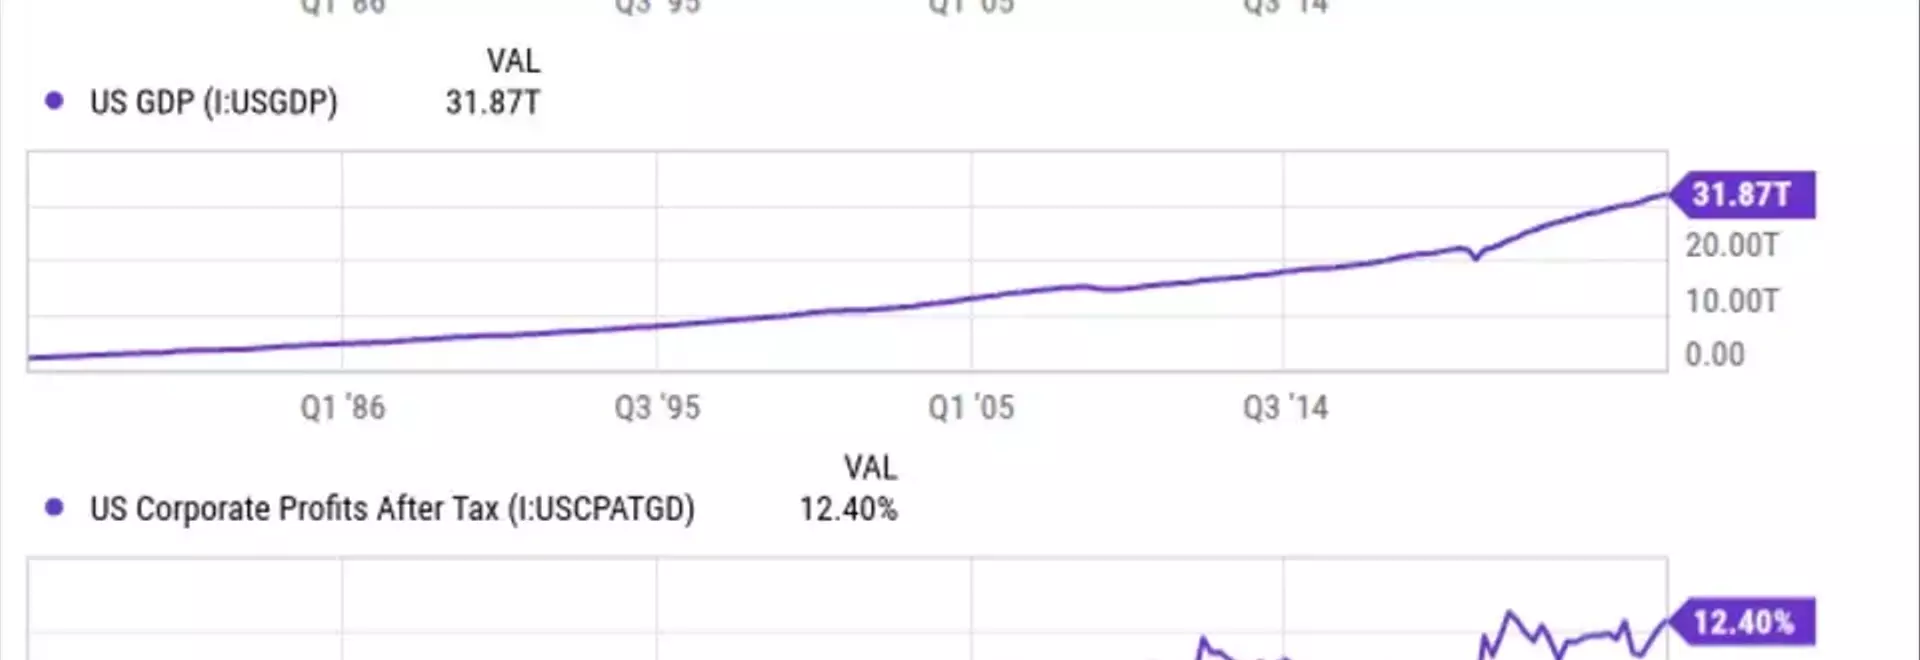
A significant factor often overlooked is the dramatic surge in corporate profits after tax. Over the past few decades, corporate profits have grown at a much faster rate than the nation's GDP. Currently, corporate profits represent approximately 12% of the U.S. GDP, a twofold increase compared to just a few decades ago. This growth is partly due to expanded profit margins and, crucially, a rising share of earnings generated from international operations. For instance, more than 40% of the S&P 500 companies' first-quarter revenue originated from foreign economies, which do not contribute to the U.S. GDP figure. This international revenue significantly boosts company valuations without directly impacting the domestic GDP component of the indicator.

A More Balanced Perspective: Market Valuation in the Context of Earnings

Considering the robust corporate earnings, the current market may not be as overvalued as the Buffett indicator suggests. The S&P 500, for example, is presently trading at a forward price-to-earnings ratio of 21.5, which is generally considered a reasonable valuation. This perspective implies that while the total market cap is high relative to GDP, it is supported by a strong underlying profit base, especially when accounting for global revenue streams.

Beyond the Headline: Why the Record-High Indicator Isn't a Call for Panic

The record-high Buffett indicator should not be a sole determinant for investor decisions. While Buffett himself has never claimed it to be an infallible measure, it serves as one piece of a larger puzzle. It's essential for investors to consider a broader range of factors when assessing market health. Although the market faces potential risks, such as fluctuating interest rates and evolving trends in artificial intelligence, these concerns do not automatically validate the idea of an imminent market collapse simply because of a high market-cap-to-GDP ratio. The market's overall value is substantial due to the sheer number and profitability of publicly traded companies, many of which are adept at generating significant earnings independently of domestic GDP growth. Therefore, while corrections are always a possibility, the current state of the Buffett indicator does not inherently predict an impending major crash. Stock picking remains a dynamic process, demanding individual evaluation of each investment opportunit

More Articles
Money
Leading Tech and Semiconductor Firms' Equity Raises Signal Market Crossroads
SpaceX, Alphabet, and SK Hynix recently executed major equity capital raises totaling approximately $200 billion, setting new records on Wall Street. This substantial influx of capital, secured through stock offerings rather than traditional debt, suggests that these prominent companies perceive current market valuations as highly favorable for issuing equity. This trend could indicate a potential shift in the broader stock market, prompting investors to reassess long-term value against current prices and capital costs.
By Natalie PaceJul 05, 2026
Money
A Detailed Comparison of SPYI and JEPI for Covered-Call ETF Investors
This analysis delves into a comparison of SPYI and JEPI, two popular S&P 500 covered-call ETFs, highlighting their distinct investment strategies, performance disparities, and tax implications. While SPYI has outperformed JEPI in rising markets due to its full S&P 500 exposure and tax-efficient structure, JEPI offers enhanced stability during market downturns with its low-volatility approach. Investors must weigh their market outlook and tax situation to determine which ETF best aligns with their financial objectives.
By JL CollinsJul 05, 2026
Money
A Comparative Analysis of Pharmaceutical ETFs: IHE vs. PJP
This article provides a comprehensive comparison between two prominent pharmaceutical Exchange Traded Funds (ETFs), iShares U.S. Pharmaceuticals ETF (IHE) and Invesco Pharmaceuticals ETF (PJP). It delves into their fee structures, dividend yields, portfolio compositions, and risk profiles to help investors determine which fund aligns better with their investment strategy in the dynamic pharmaceutical sector.
By Mr. Money MustacheJul 05, 2026
Money
The Resilient Rise of Bitcoin: A Premier Cryptocurrency Choice
Despite market volatility and significant drawdowns, Bitcoin consistently demonstrates its ability to recover and achieve new highs. Its unique resilience, coupled with growing institutional adoption from diverse entities, solidifies its position as a leading cryptocurrency. This article explores Bitcoin's historical performance, its increasing integration into mainstream finance, and its potential for future growth, advocating for its continued relevance as a long-term investment.
By Scott PapeJul 05, 2026
Money
The $185,000 Portfolio for Essential Monthly Expenses
A strategic $185,000 investment in Treasury bills, yielding approximately 4%, can generate $617 per month. This income is specifically designed to cover recurring household expenses like groceries, utilities, and phone bills, providing a buffer against the rising cost of living. The approach leverages staggered maturities of T-bills to ensure a consistent cash flow, although its effectiveness is sensitive to fluctuating interest rates and does not account for larger costs such as rent or healthcare.
By Bola SokunbiJul 05, 2026